Candlestick Library
candlesticks
Graphical representation of the stock movement in candlestick form
Author(s): Jose David
Implementation Notes
Adafruit CircuitPython firmware for the supported boards: https://github.com/adafruit/circuitpython/releases
- class candlesticks.Candlestick(dist_x: int, openp: int, close: int, high: int, low: int, color_green: int = 65280, color_red: int = 16711680, screen_ref: int = 180)
A graphical candlestick representation
- Parameters:
dist_x (int) – number of segments in each bar
openp (int) – Stock open price
close (int) – Stock close price
high (int) – Stock high price
low (int) – Stock low price
color_green (int) – When stock close price is higher thant the price opening candlestick are representing by a green color. This allows the selection of the color of your choice
color_red (int) – When stock close price is lower thant the price opening candlestick are representing by a red color. This allows the selection of the color of your choice
screen_ref (int) – Distance in pixels from the left to the screem to locate the candlestick. This allows to present different candlesticks in the same screen
Quickstart: Importing and using Candlestick
Here is one way of importing the
Candlestickclass, so you can use it as the namemy_candle:from CircuitPython_Candlesticks.candlesticks import Candlestick as Candlestick
Now you can create a plane at pixel position x=100, open price=60 close price=30 high price=80 low price=5 using:
my_candle = Candlestick(100, 60, 30, 80, 5)
Once you set up your display, you can now add
my_candleto your display using:display.show(my_plane) # add the group to the display
If you want to have multiple display elements, you can create a group and then append the plane and the other elements to the group. Then, you can add the full group to the display as in this example:
my_candle = Candlestick(100, 60, 30, 80, 5)
my_group = displayio.Group() # make a group
my_group.append(my_plane) # Add my_plane to the group

#
# Append other display elements to the group
#

display.show(my_group) # add the group to the display
Summary: Cartesian Features and input variables
The
Candlestickclass has some options for controlling its position, appearance, through a collection of input variables:position:
xcolor:
color_green,color_red
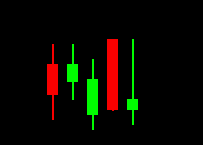
Diagram showing 5 different candlesticks.